
| Measure | WTTC Caribbean region | Commonwealth Caribbean, all twelve | Commonwealth Caribbean, ten tourism-led |
|---|---|---|---|
| Tourism share of GDP | 18.0% | 21.5% | 38.0% |
| Tourism share of all jobs | 16.3% | 29.6% | 37.1% |
| Change in GDP share since 2019, percentage points | +3.9 | −4.6 | +0.5 |
| Growth gap, tourism minus whole economy, percentage points | +1.8 | −6.8 | −1.6 |
| Visitor exports, share of total exports | 16.8% | 27.1% | 57.3% |
| International share of tourism spending | 74.6% | 84.0% | 90.7% |
The ten tourism-led markets exclude Guyana and Trinidad and Tobago, whose energy sectors dominate any aggregate they sit in. Together they account for approximately 50% of combined Commonwealth Caribbean GDP but only 12% of combined tourism GDP, so both versions are shown throughout.
Three findings follow.
Dependence is materially higher than the regional figure indicates. On employment the gap is widest: tourism supports 29.6% of all jobs across the twelve markets, and 37.1% once the two energy economies are set aside, against 16.3% for the region WTTC reports. A ministry planning for sector disruption on the regional number is planning for roughly half the labour market exposure it actually carries.
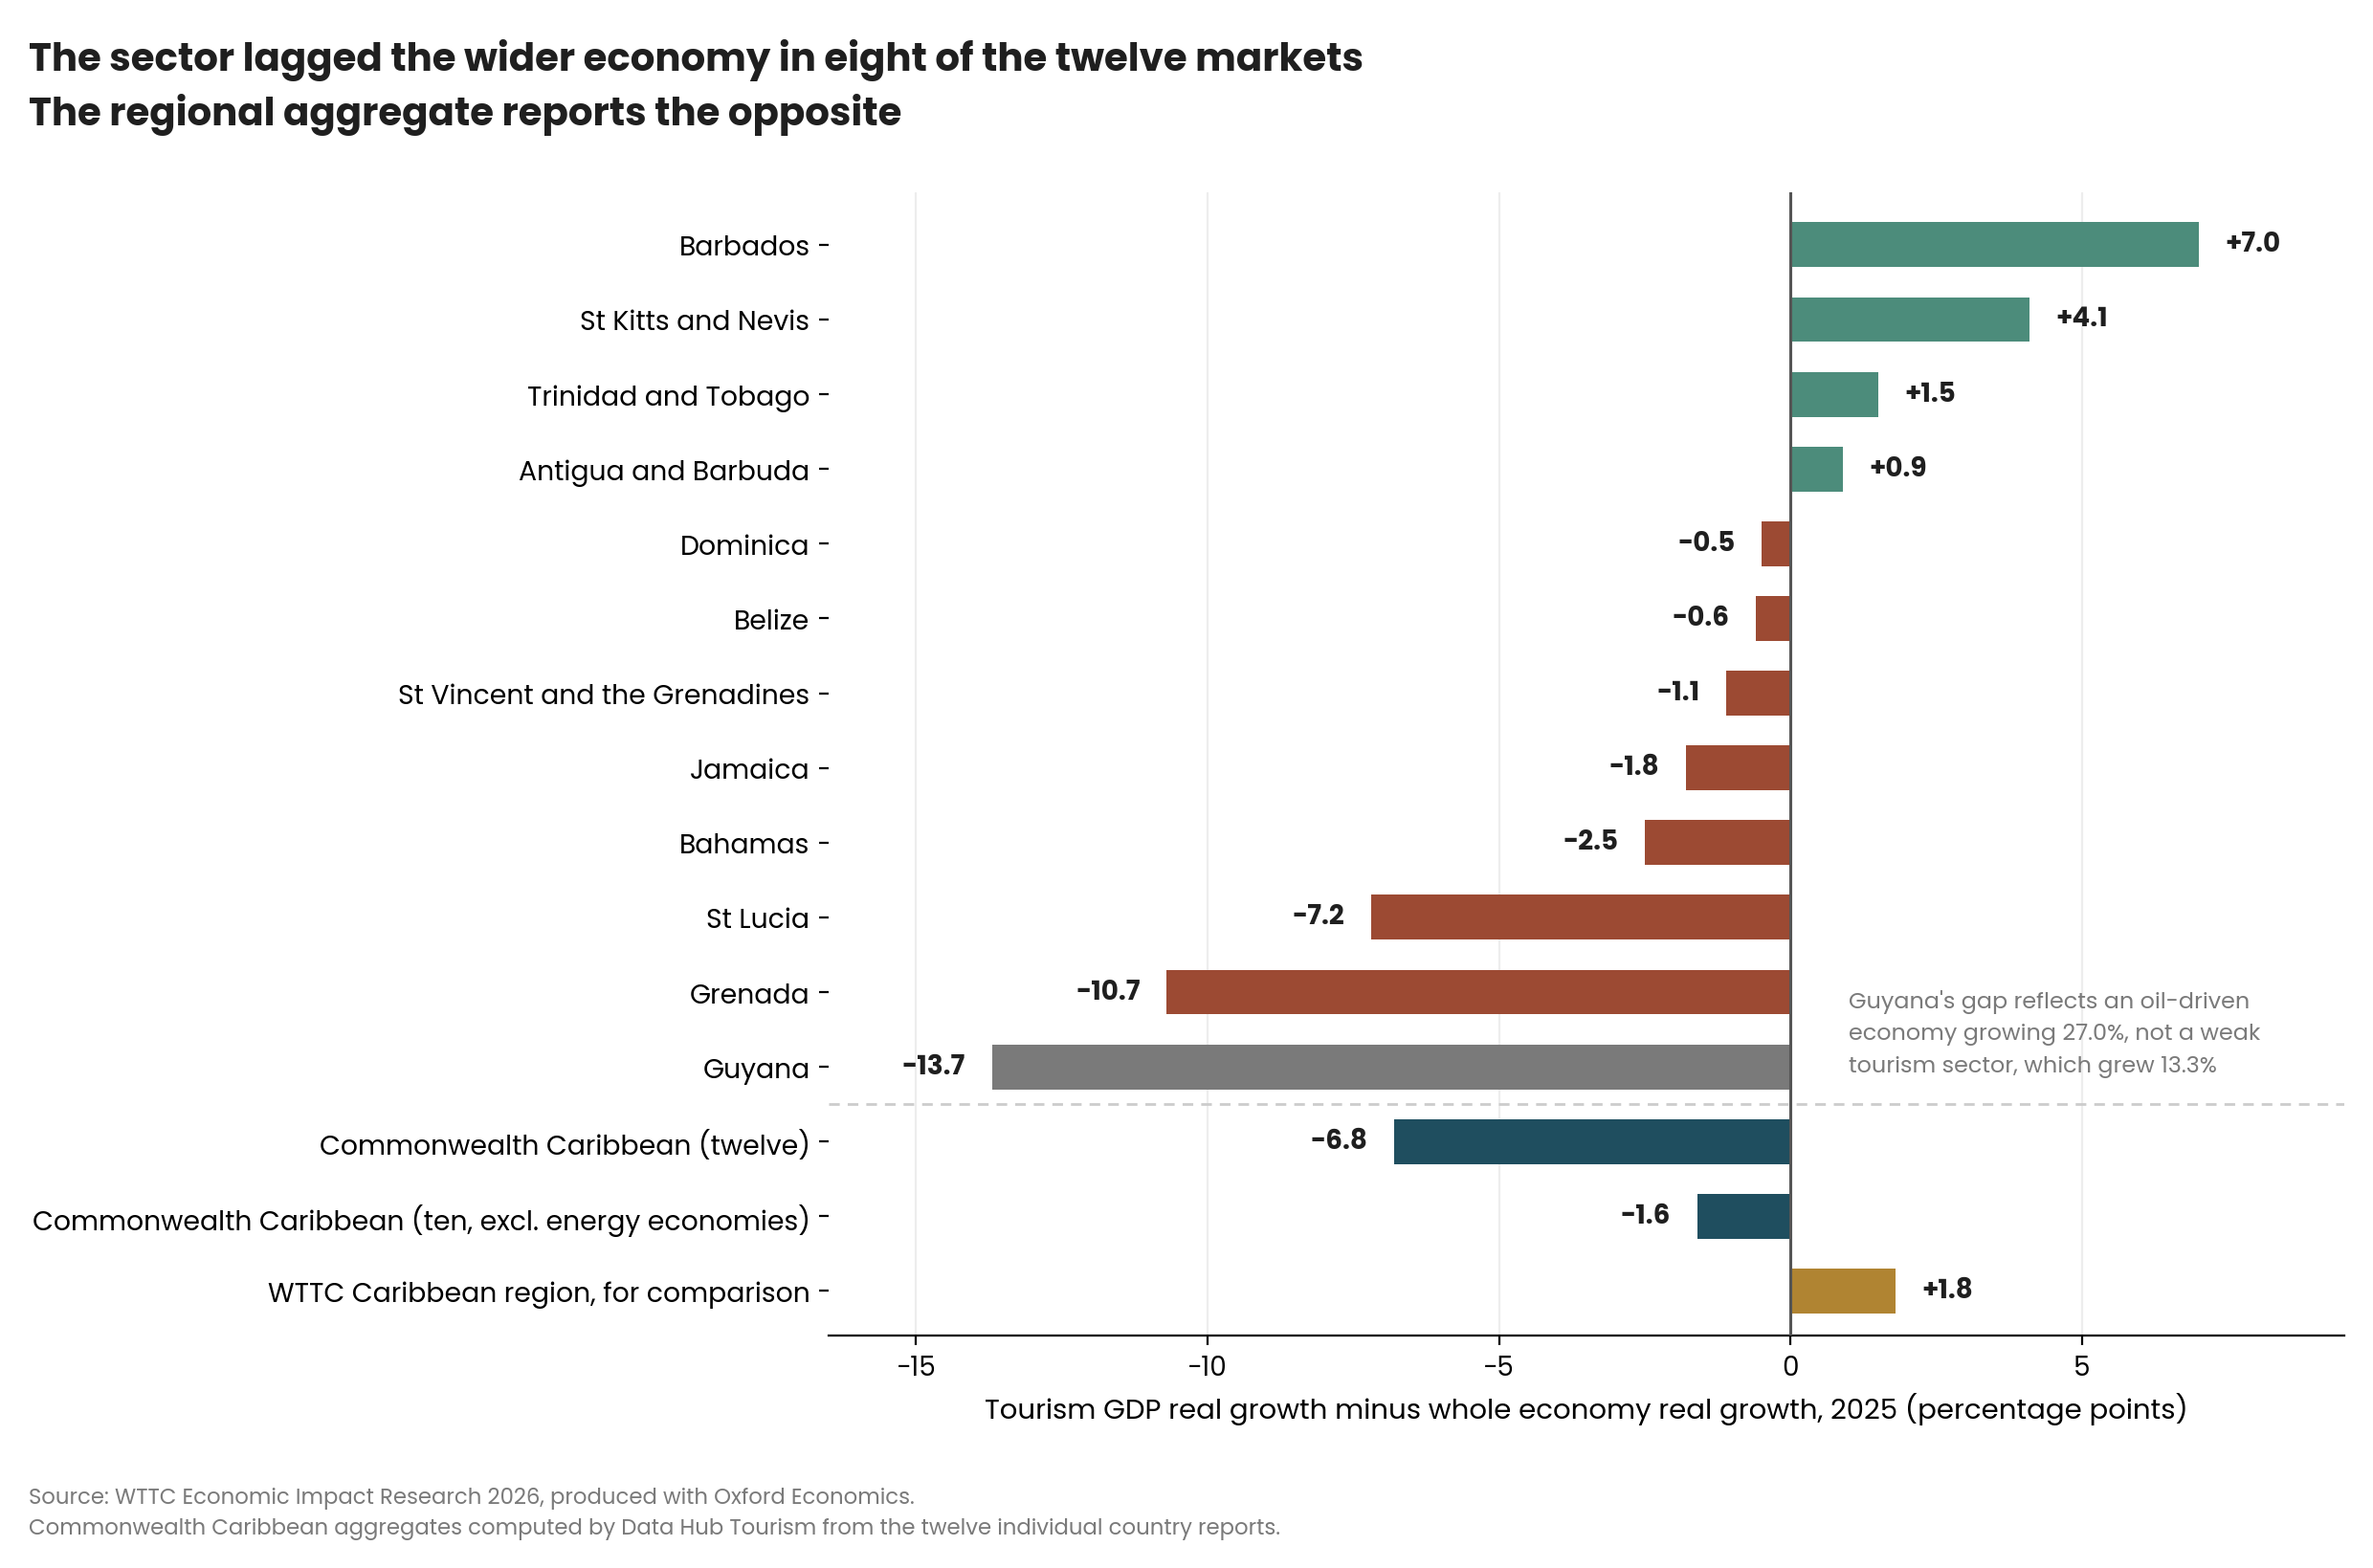
The sector lagged its own economies in 2025. Tourism GDP grew more slowly in real terms than the wider economy in eight of the twelve markets. On the combined Commonwealth Caribbean aggregate the sector trailed the economy by 6.8 percentage points, or by 1.6 points excluding the energy economies. The regional figure reports the opposite, at positive 1.8 points. WTTC's own foreword describes a sector that came back stronger. For these twelve markets, the country-level data in the same publication do not support that reading.
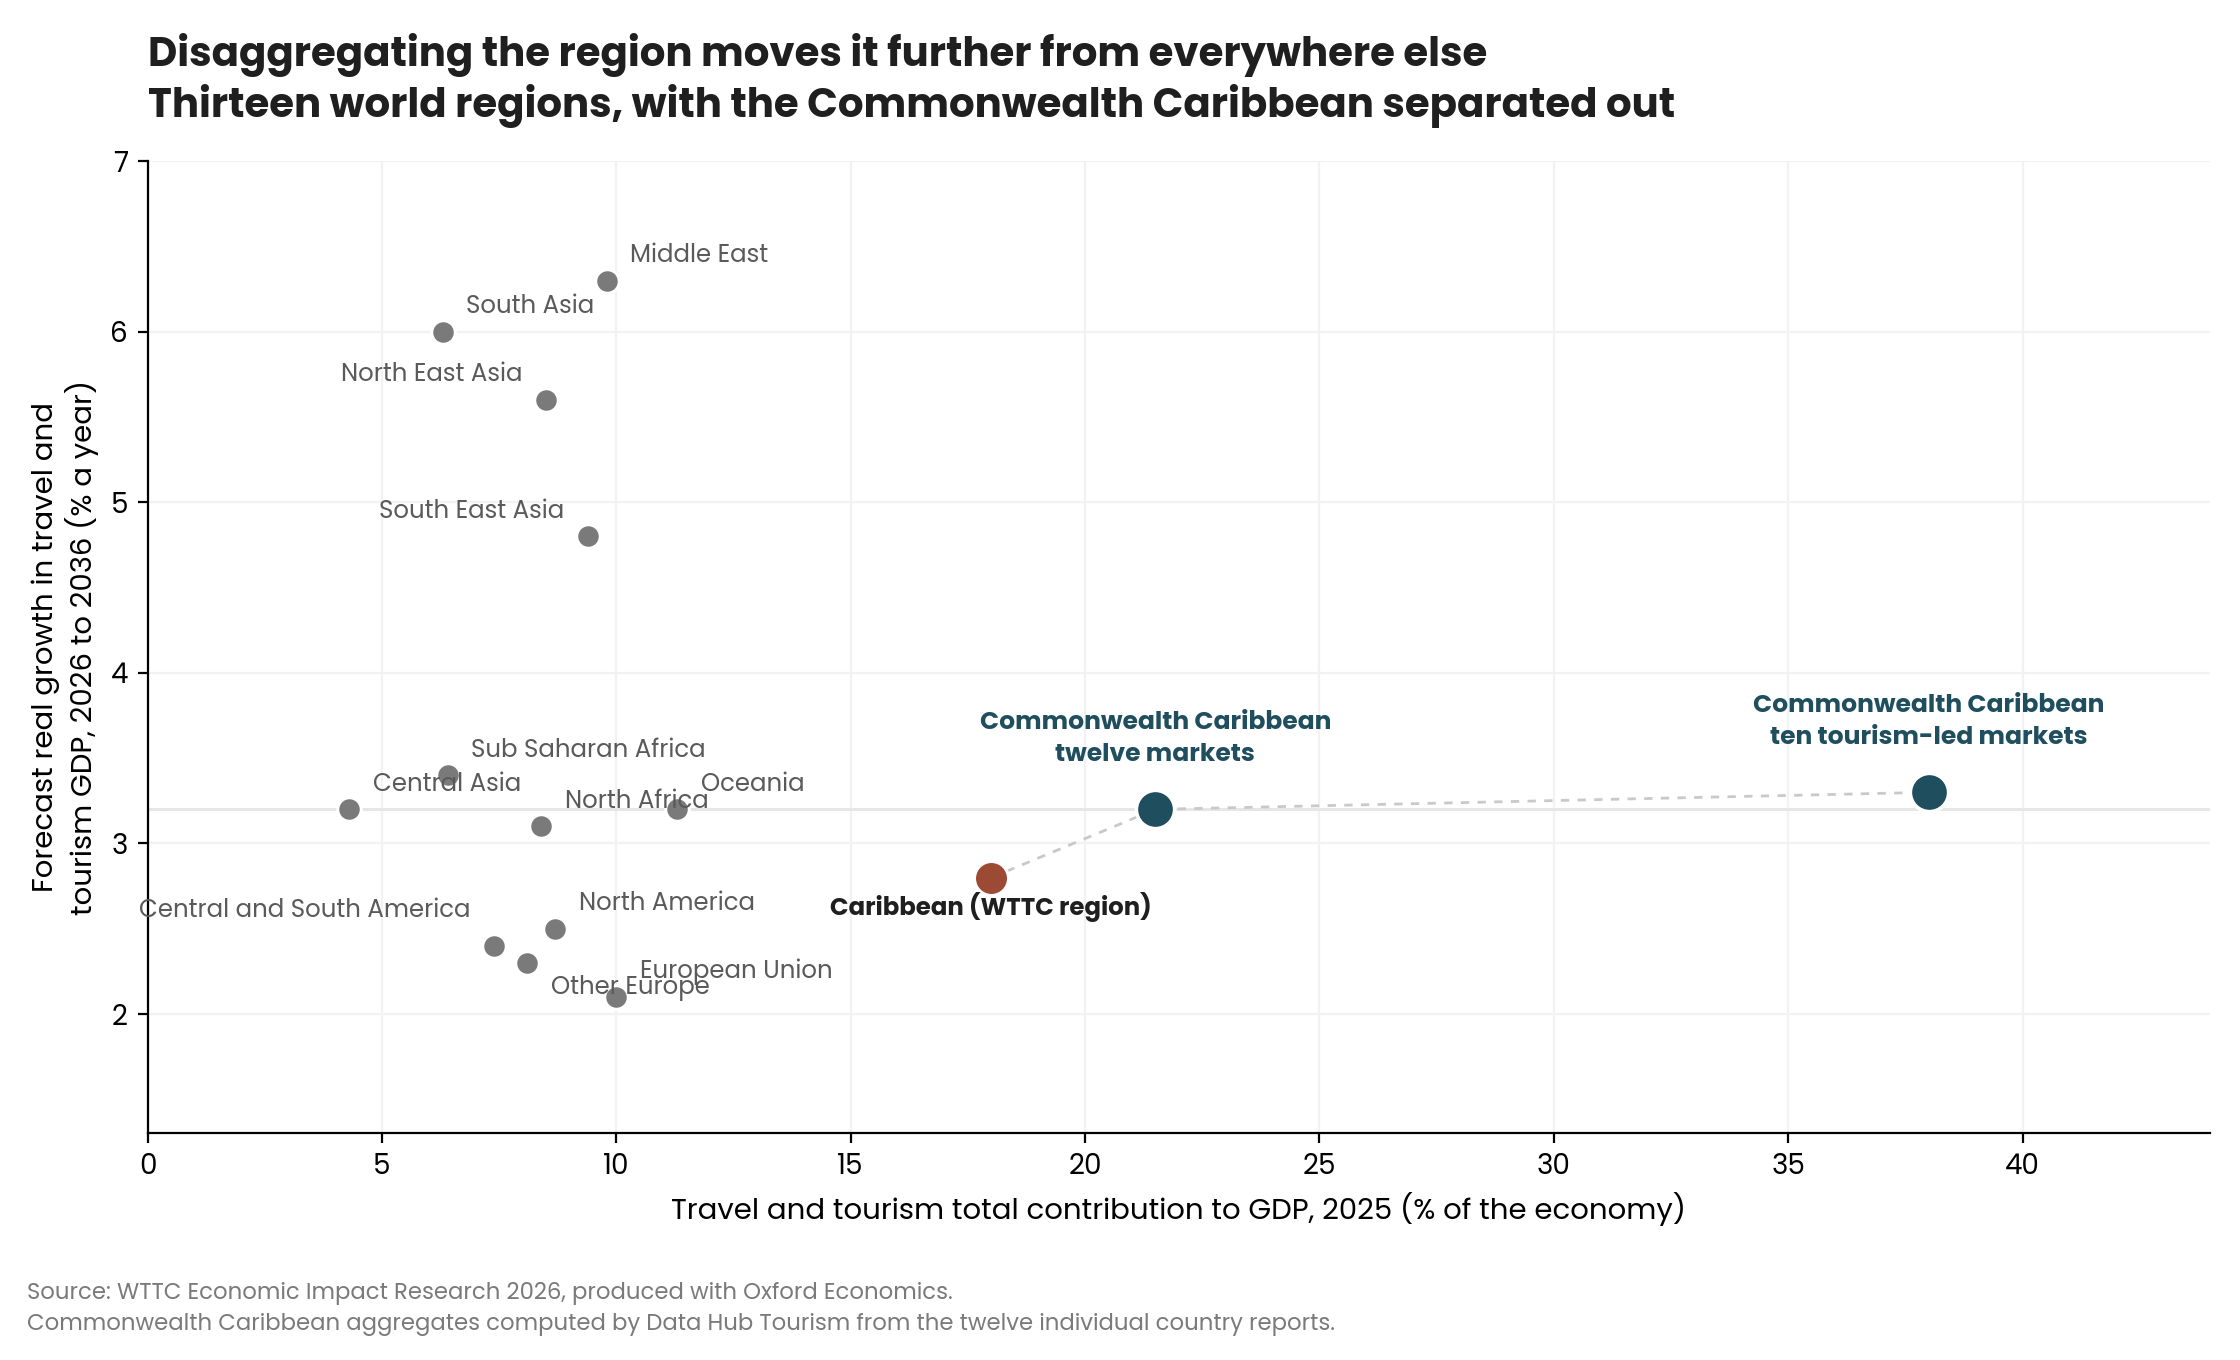
Dependence is not being converted into growth. Counted separately, the Commonwealth Caribbean would rank first among the thirteen world regions WTTC publishes on tourism's share of GDP, by a wide margin, and its forecast tourism GDP growth of around 3.2% a year to 2036 would place it around the middle of that group. High exposure, ordinary growth.
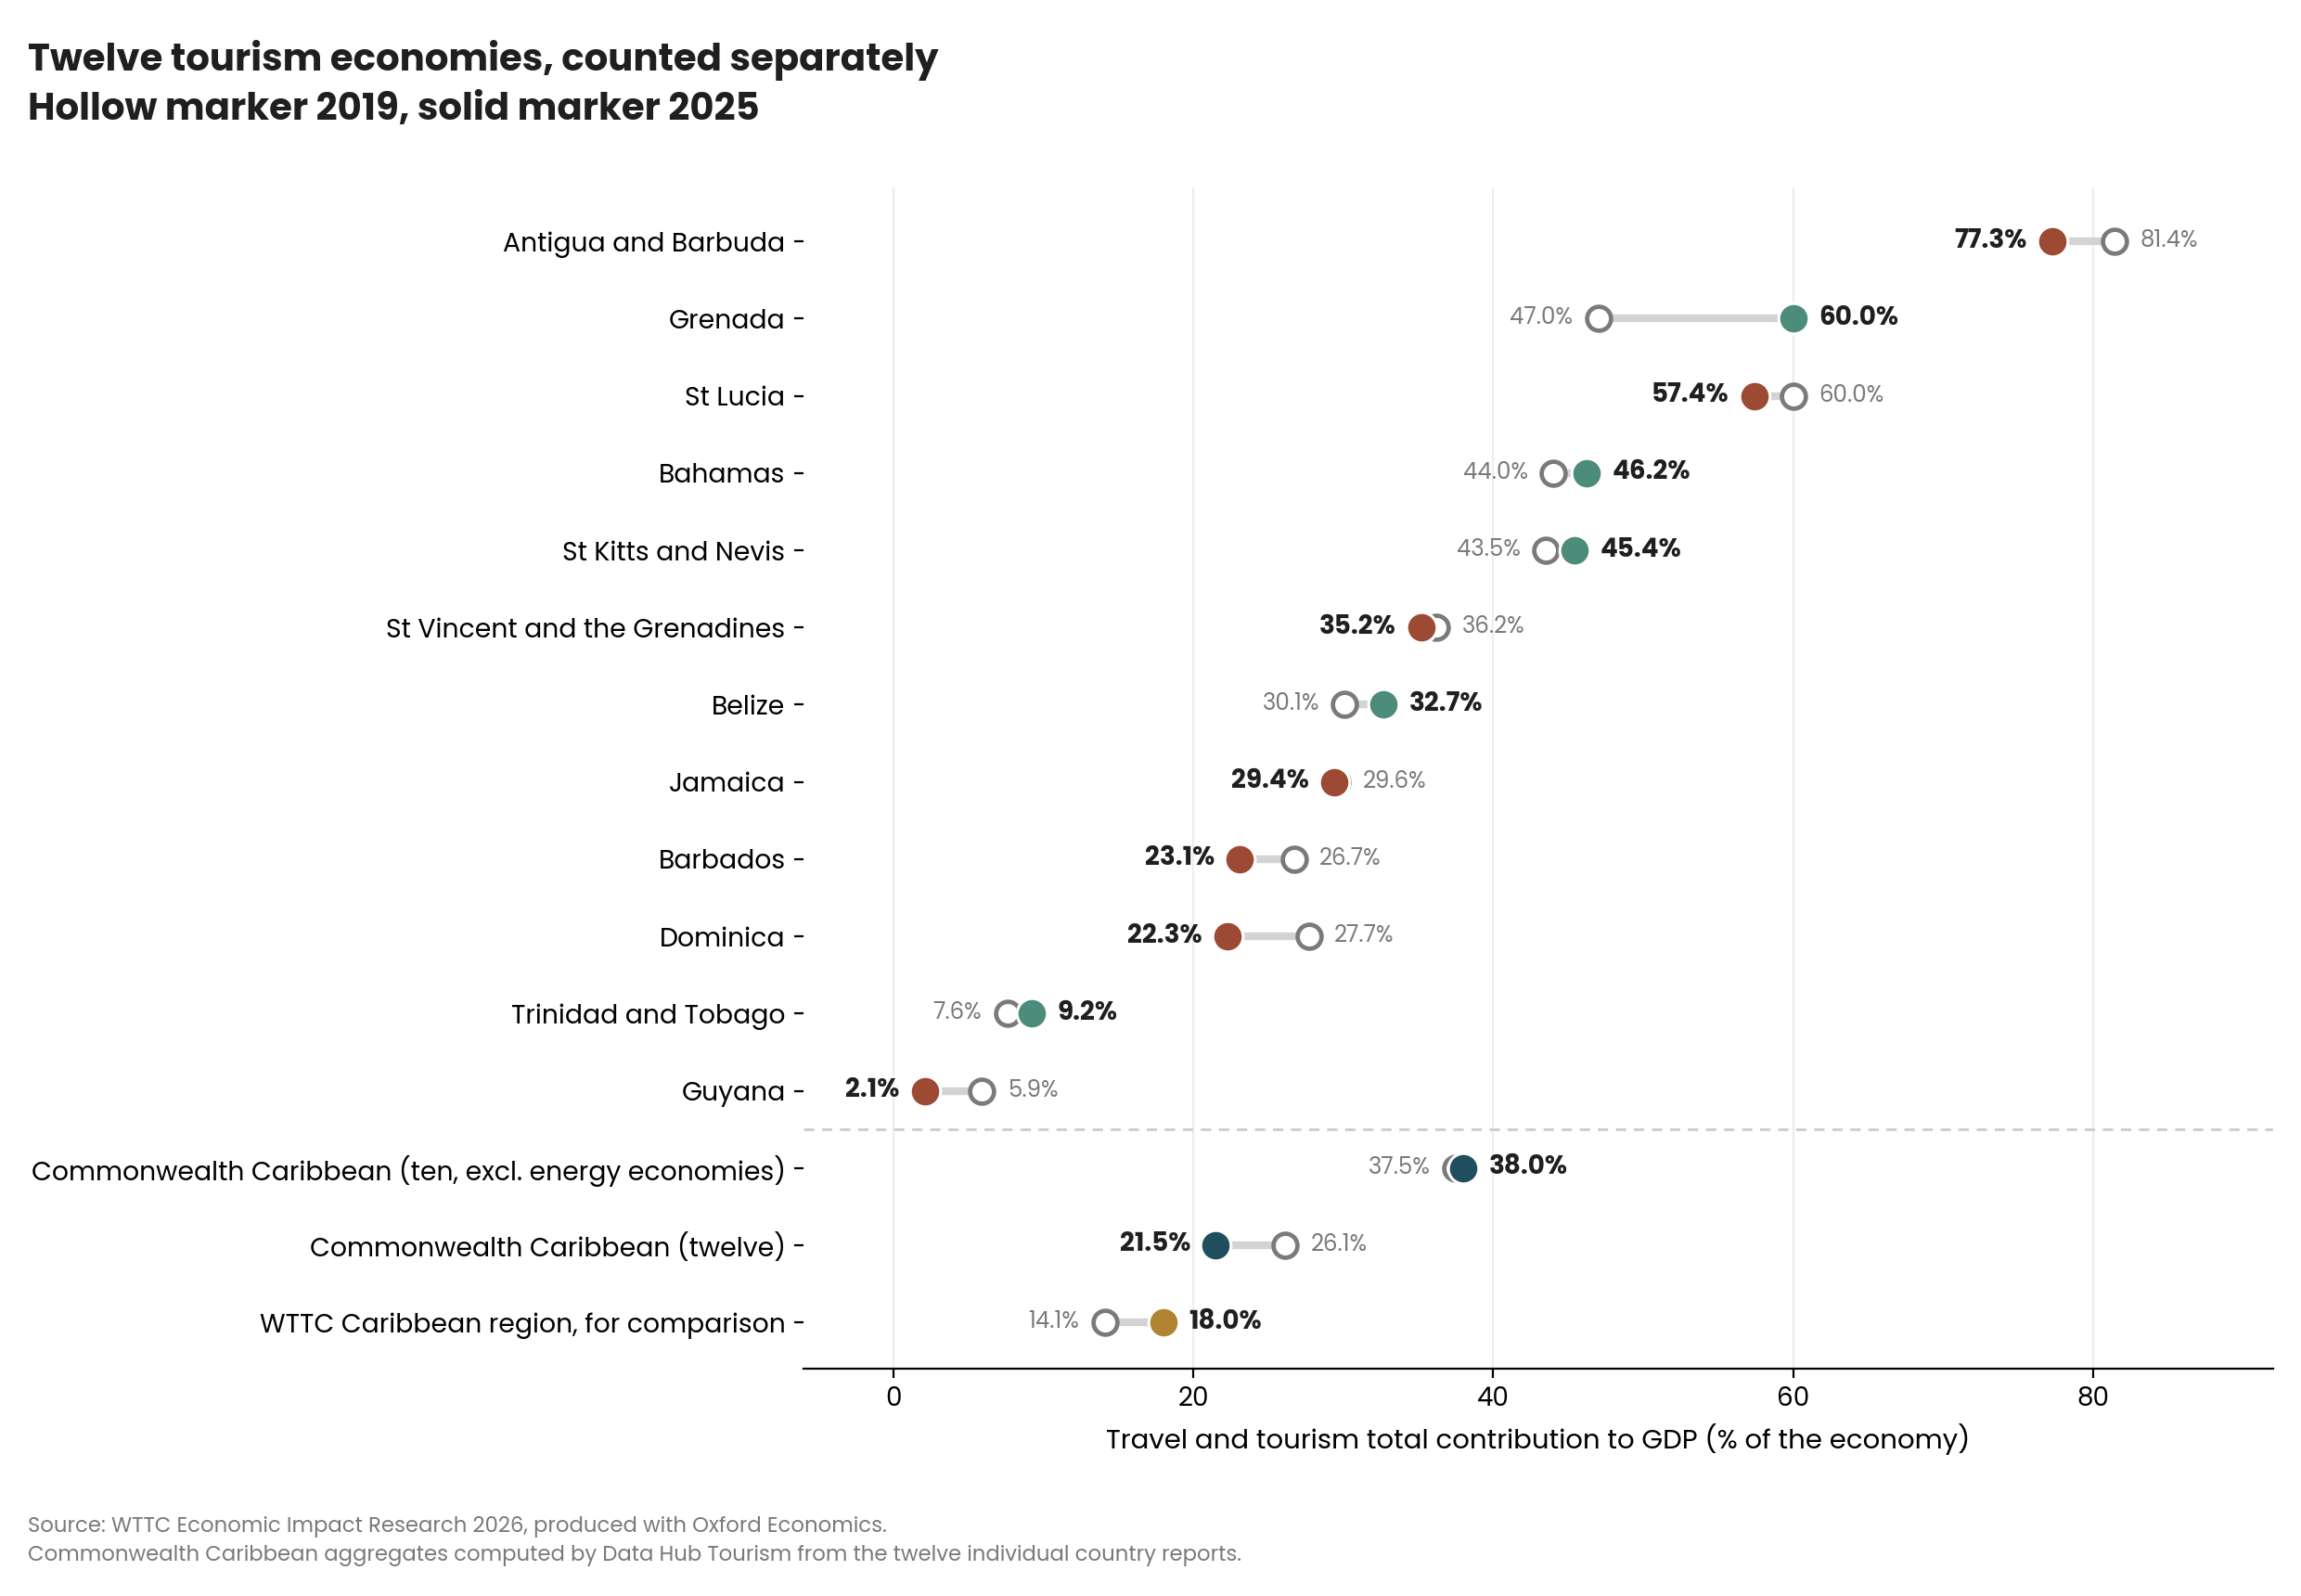
There is a fourth point, about variation rather than level. Tourism's total contribution to GDP in 2025 ranges from 2.1% in Guyana to 77.3% in Antigua and Barbuda, a spread of a factor of thirty-seven. Share of employment ranges from 8.7% to 86.3%. Visitor exports range from 0.6% to 81.4% of total exports. These markets share a sea, a language and in most cases a currency arrangement. They do not share an economic model, and a Commonwealth Caribbean average is itself an aggregate to be used with care.
Reading the share correctly
Tourism's share of GDP is a ratio. It moves when the sector moves, and it moves when the rest of the economy moves, and the published figure does not distinguish between the two. In this group the distinction is not academic, because two of the twelve markets are in the middle of energy shocks running in opposite directions.
Guyana. Tourism's share fell from 5.9% of GDP in 2019 to 2.1% in 2025. Real tourism output over the same period rose 141.9%. The share fell because the denominator exploded. Guyana's first oil came onstream in December 2019, and by 2025 the ExxonMobil-led Stabroek consortium was operating four production vessels, with crude output through 2025 totalling 261.1 million barrels against 225.4 million in 2024. Real GDP grew 19.3% in 2025, and GDP per capita rose from under USD 7,000 in 2019 to USD 32,414 in 2025. The WTTC figures imply that Guyana's whole economy grew roughly 580% in real terms between 2019 and 2025, which is consistent with the compounded national accounts. Guyana's falling tourism share is a measure of the oil sector, not of its tourism sector.
Trinidad and Tobago. Tourism's share rose from 7.6% of GDP in 2019 to 9.2% in 2025. Real tourism output rose 14.7%, so part of that is genuine. But the WTTC figures also imply that Trinidad and Tobago's whole economy was approximately 5% smaller in real terms in 2025 than in 2019. That is consistent with a maturing gas base: production peaked at 4 billion cubic feet a day in 2010 and has since fallen by more than a third, and output averaged 2,541 million standard cubic feet a day in 2025 before slipping to roughly 2,427 million over the first quarter of 2026, about 4.5% below the 2025 average. A rising tourism share here is as much a statement about contracting energy output as about tourism performance.
The same decomposition applies to every market, comparing the published real change in tourism GDP with the change in the whole economy implied by the published contribution and share.
| Market | Real change in tourism GDP, 2019 to 2025 | Implied real change in the whole economy | Change in tourism share, percentage points | What moved |
|---|---|---|---|---|
| Guyana | +141.9% | +579.6% | −3.8 | Economy, on oil |
| Belize | +28.3% | +18.1% | +2.6 | Tourism led |
| Grenada | +34.8% | +5.6% | +13.0 | Tourism led |
| Bahamas | +19.2% | +13.5% | +2.2 | Tourism led |
| St Vincent and the Grenadines | +13.0% | +16.2% | −1.0 | Economy led |
| Trinidad and Tobago | +14.7% | −5.2% | +1.6 | Economy, contracting |
| St Lucia | +9.4% | +14.4% | −2.6 | Economy led |
| St Kitts and Nevis | +4.2% | −0.2% | +1.9 | Tourism led, economy flat |
| Antigua and Barbuda | +2.3% | +7.7% | −4.1 | Economy led |
| Jamaica | +0.5% | +1.2% | −0.2 | Both flat |
| Barbados | −3.7% | +11.3% | −3.6 | Tourism fell, economy grew |
| Dominica | −15.4% | +5.1% | −5.4 | Tourism fell, economy grew |
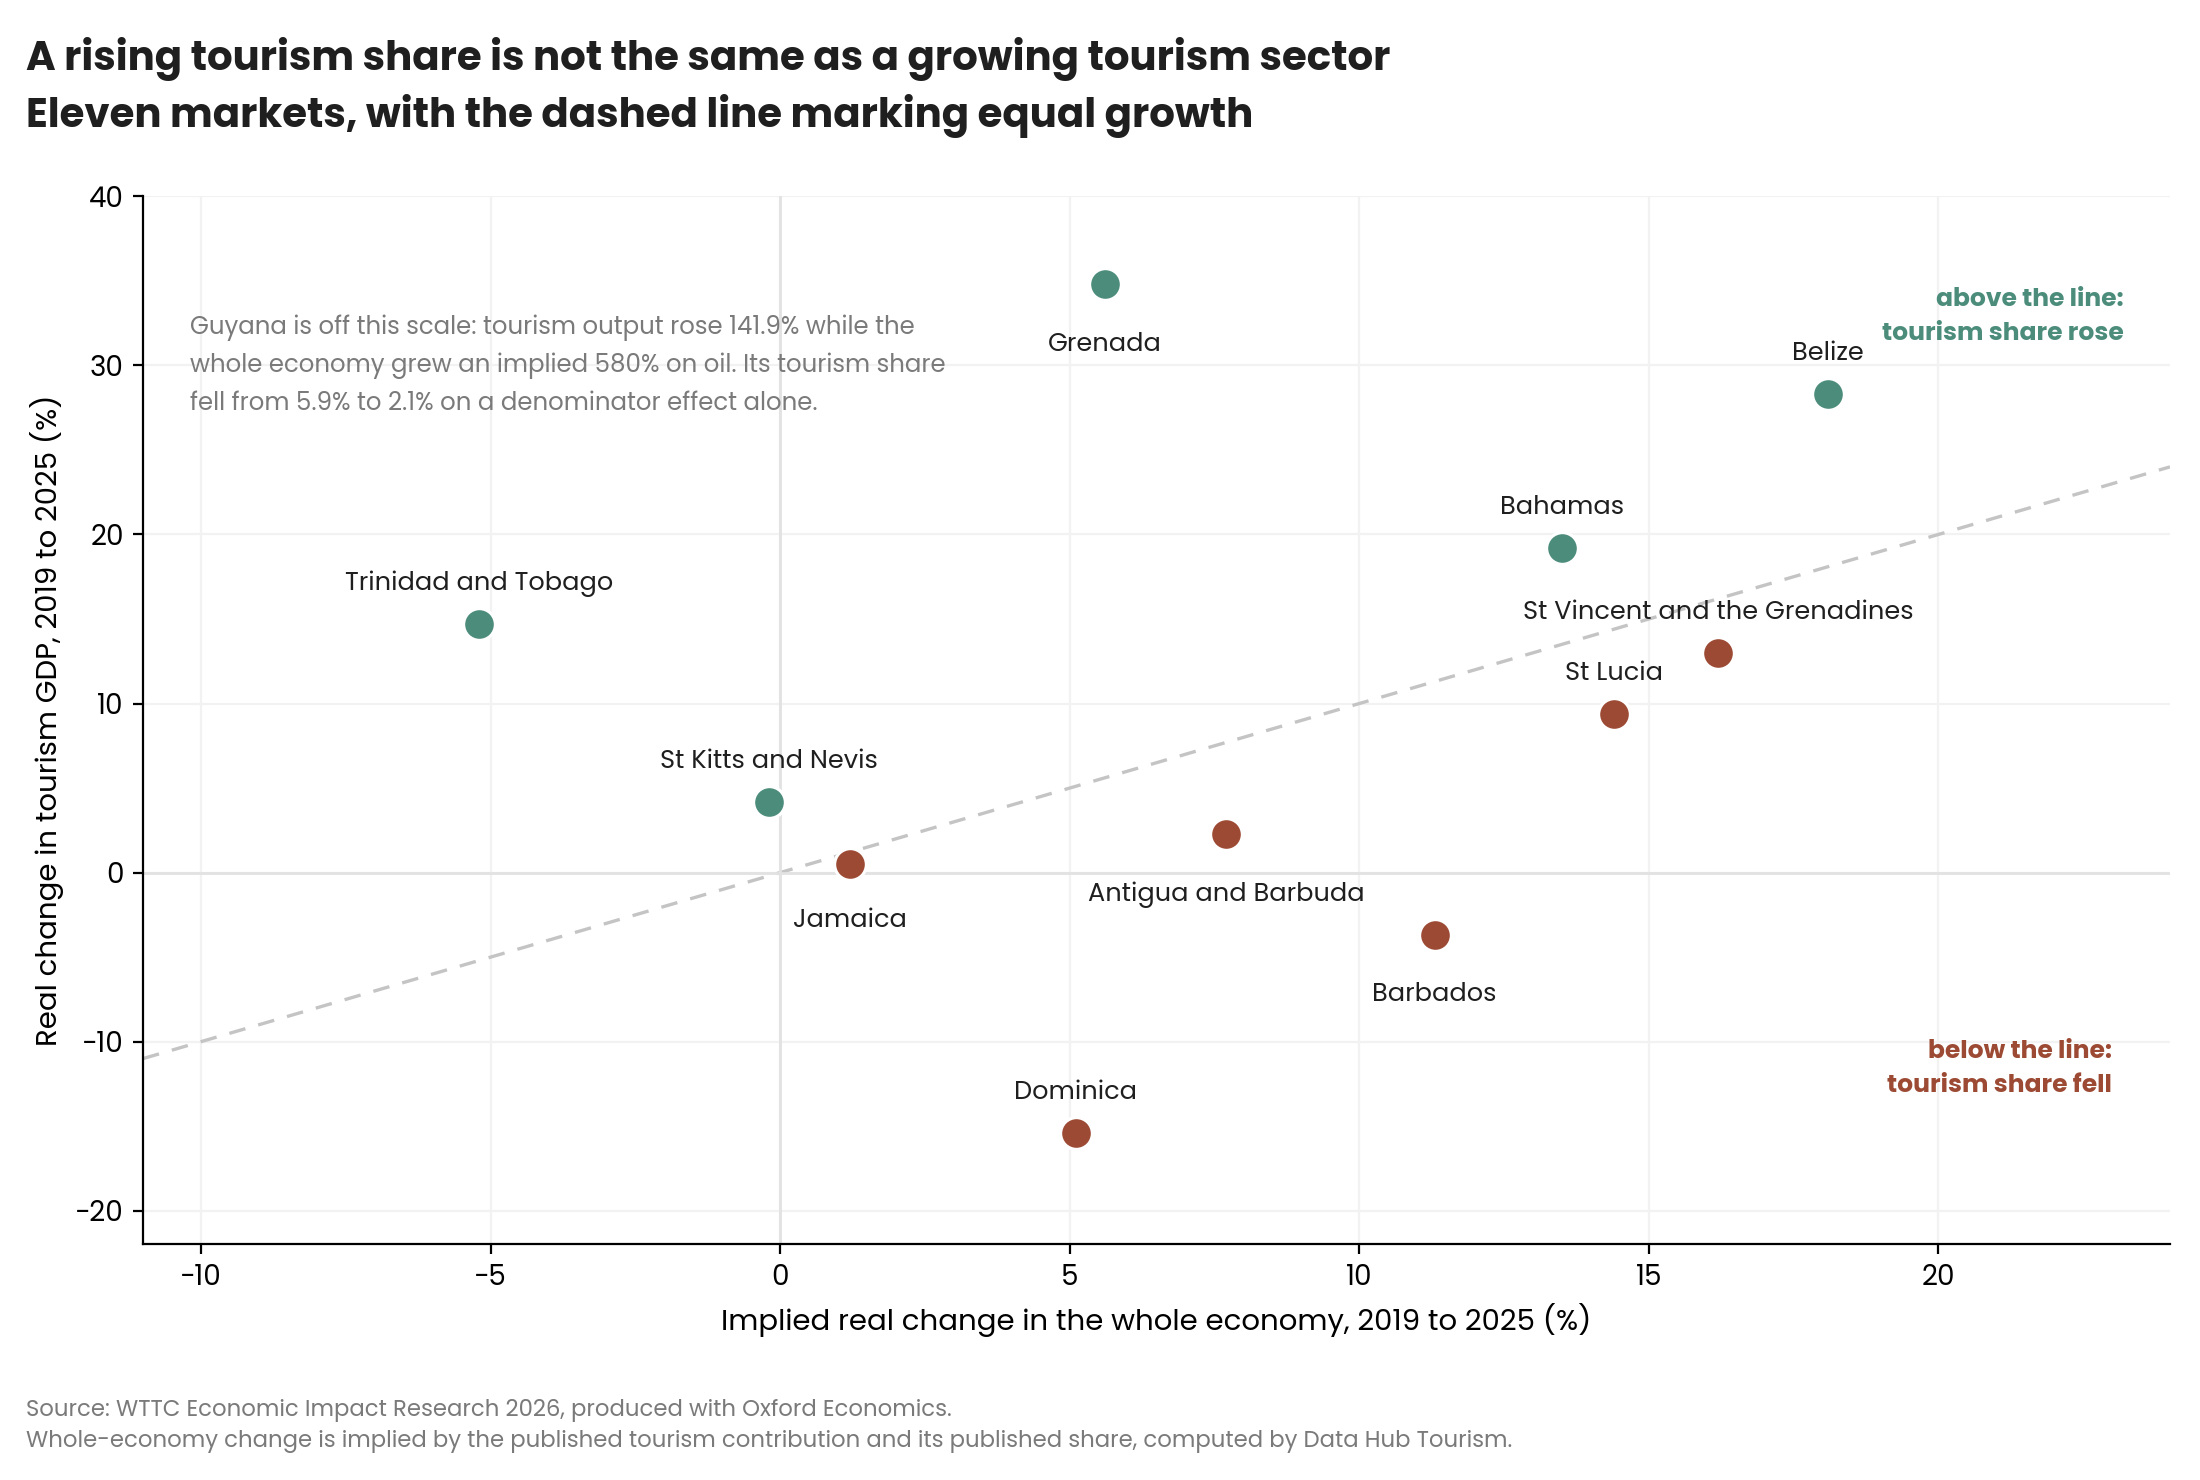
Read this way, the pattern differs from the one the share figures alone suggest. Only four markets have a rising tourism share driven by tourism outgrowing the economy, and only one of those, Grenada, by a wide margin. In two markets the share fell while tourism output itself contracted, which is the genuinely adverse case. In two others the share movement is an energy story.
The numbers, side by side
Table 1: Economic weight and 2025 trading
| Market | Total contribution to GDP, 2025 | Share of GDP, 2025 | Share of GDP, 2019 | Change, percentage points | Tourism GDP real growth, 2025 | Whole economy real growth, 2025 | Real change vs 2019 |
|---|---|---|---|---|---|---|---|
| Antigua and Barbuda | USD 1.82 bn | 77.3% | 81.4% | −4.1 | +4.2% | +3.3% | +2.3% |
| Grenada | USD 889.1 mn | 60.0% | 47.0% | +13.0 | −7.2% | +3.5% | +34.8% |
| St Lucia | USD 1.56 bn | 57.4% | 60.0% | −2.6 | −4.0% | +3.2% | +9.4% |
| Bahamas | USD 7.62 bn | 46.2% | 44.0% | +2.2 | +0.5% | +3.0% | +19.2% |
| St Kitts and Nevis | USD 539.7 mn | 45.4% | 43.5% | +1.9 | +5.8% | +1.7% | +4.2% |
| St Vincent and the Grenadines | USD 443.0 mn | 35.2% | 36.2% | −1.0 | +2.3% | +3.4% | +13.0% |
| Belize | USD 1.08 bn | 32.7% | 30.1% | +2.6 | +0.9% | +1.5% | +28.3% |
| Jamaica | USD 6.00 bn | 29.4% | 29.6% | −0.2 | −0.8% | +1.0% | +0.5% |
| Barbados | USD 1.76 bn | 23.1% | 26.7% | −3.6 | +10.0% | +3.0% | −3.7% |
| Dominica | USD 163.7 mn | 22.3% | 27.7% | −5.4 | +3.1% | +3.6% | −15.4% |
| Trinidad and Tobago | USD 2.40 bn | 9.2% | 7.6% | +1.6 | +3.1% | +1.6% | +14.7% |
| Guyana | USD 681.2 mn | 2.1% | 5.9% | −3.8 | +13.3% | +27.0% | +141.9% |
| Commonwealth Caribbean, all twelve | USD 24.95 bn | 21.5% | 26.1% | −4.6 | +1.2% | +8.0% | +11.5% |
| Commonwealth Caribbean, ten tourism-led | USD 21.87 bn | 38.0% | 37.5% | +0.5 | +0.7% | +2.2% | +9.4% |
Table 2: Structure and exposure
| Market | Jobs supported ('000) | Share of all jobs | Visitor exports, share of total exports | International share of tourism spending | Tourism-linked taxes, share of government revenue | Largest source market |
|---|---|---|---|---|---|---|
| Antigua and Barbuda | 34.6 | 86.3% | 81.4% | 94.0% | 63.5% | United States, 54% |
| Grenada | 29.6 | 46.3% | 66.6% | 97.0% | 47.2% | United States, 42% |
| St Lucia | 67.1 | 70.1% | 79.3% | 92.5% | 40.7% | United States, 55% |
| Bahamas | 104.5 | 47.8% | 53.8% | 90.4% | 48.8% | United States, 86% |
| St Kitts and Nevis | 12.8 | 60.3% | 56.5% | 91.6% | 21.7% | United States, 57% |
| St Vincent and the Grenadines | 18.9 | 48.3% | 46.2% | 91.7% | 12.7% | United States, 42% |
| Belize | 81.7 | 49.4% | 46.5% | 92.8% | 26.9% | United States, 74% |
| Jamaica | 446.3 | 30.1% | 61.7% | 88.5% | no data available | United States, 71% |
| Barbados | 41.9 | 33.1% | 45.2% | 89.8% | 27.6% | United States, 34% |
| Dominica | 10.6 | 30.3% | 33.9% | 84.4% | 6.6% | United States, 28% |
| Trinidad and Tobago | 49.9 | 8.7% | 8.1% | 39.5% | 8.6% | United States, 47% |
| Guyana | 30.0 | 11.2% | 0.6% | 26.1% | 3.1% | United States, 41% |
| Commonwealth Caribbean, all twelve | 927.9 | 29.6% | 27.1% | 84.0% | 19.0% | — |
| Commonwealth Caribbean, ten tourism-led | 848.0 | 37.1% | 57.3% | 90.7% | 36.3% | — |
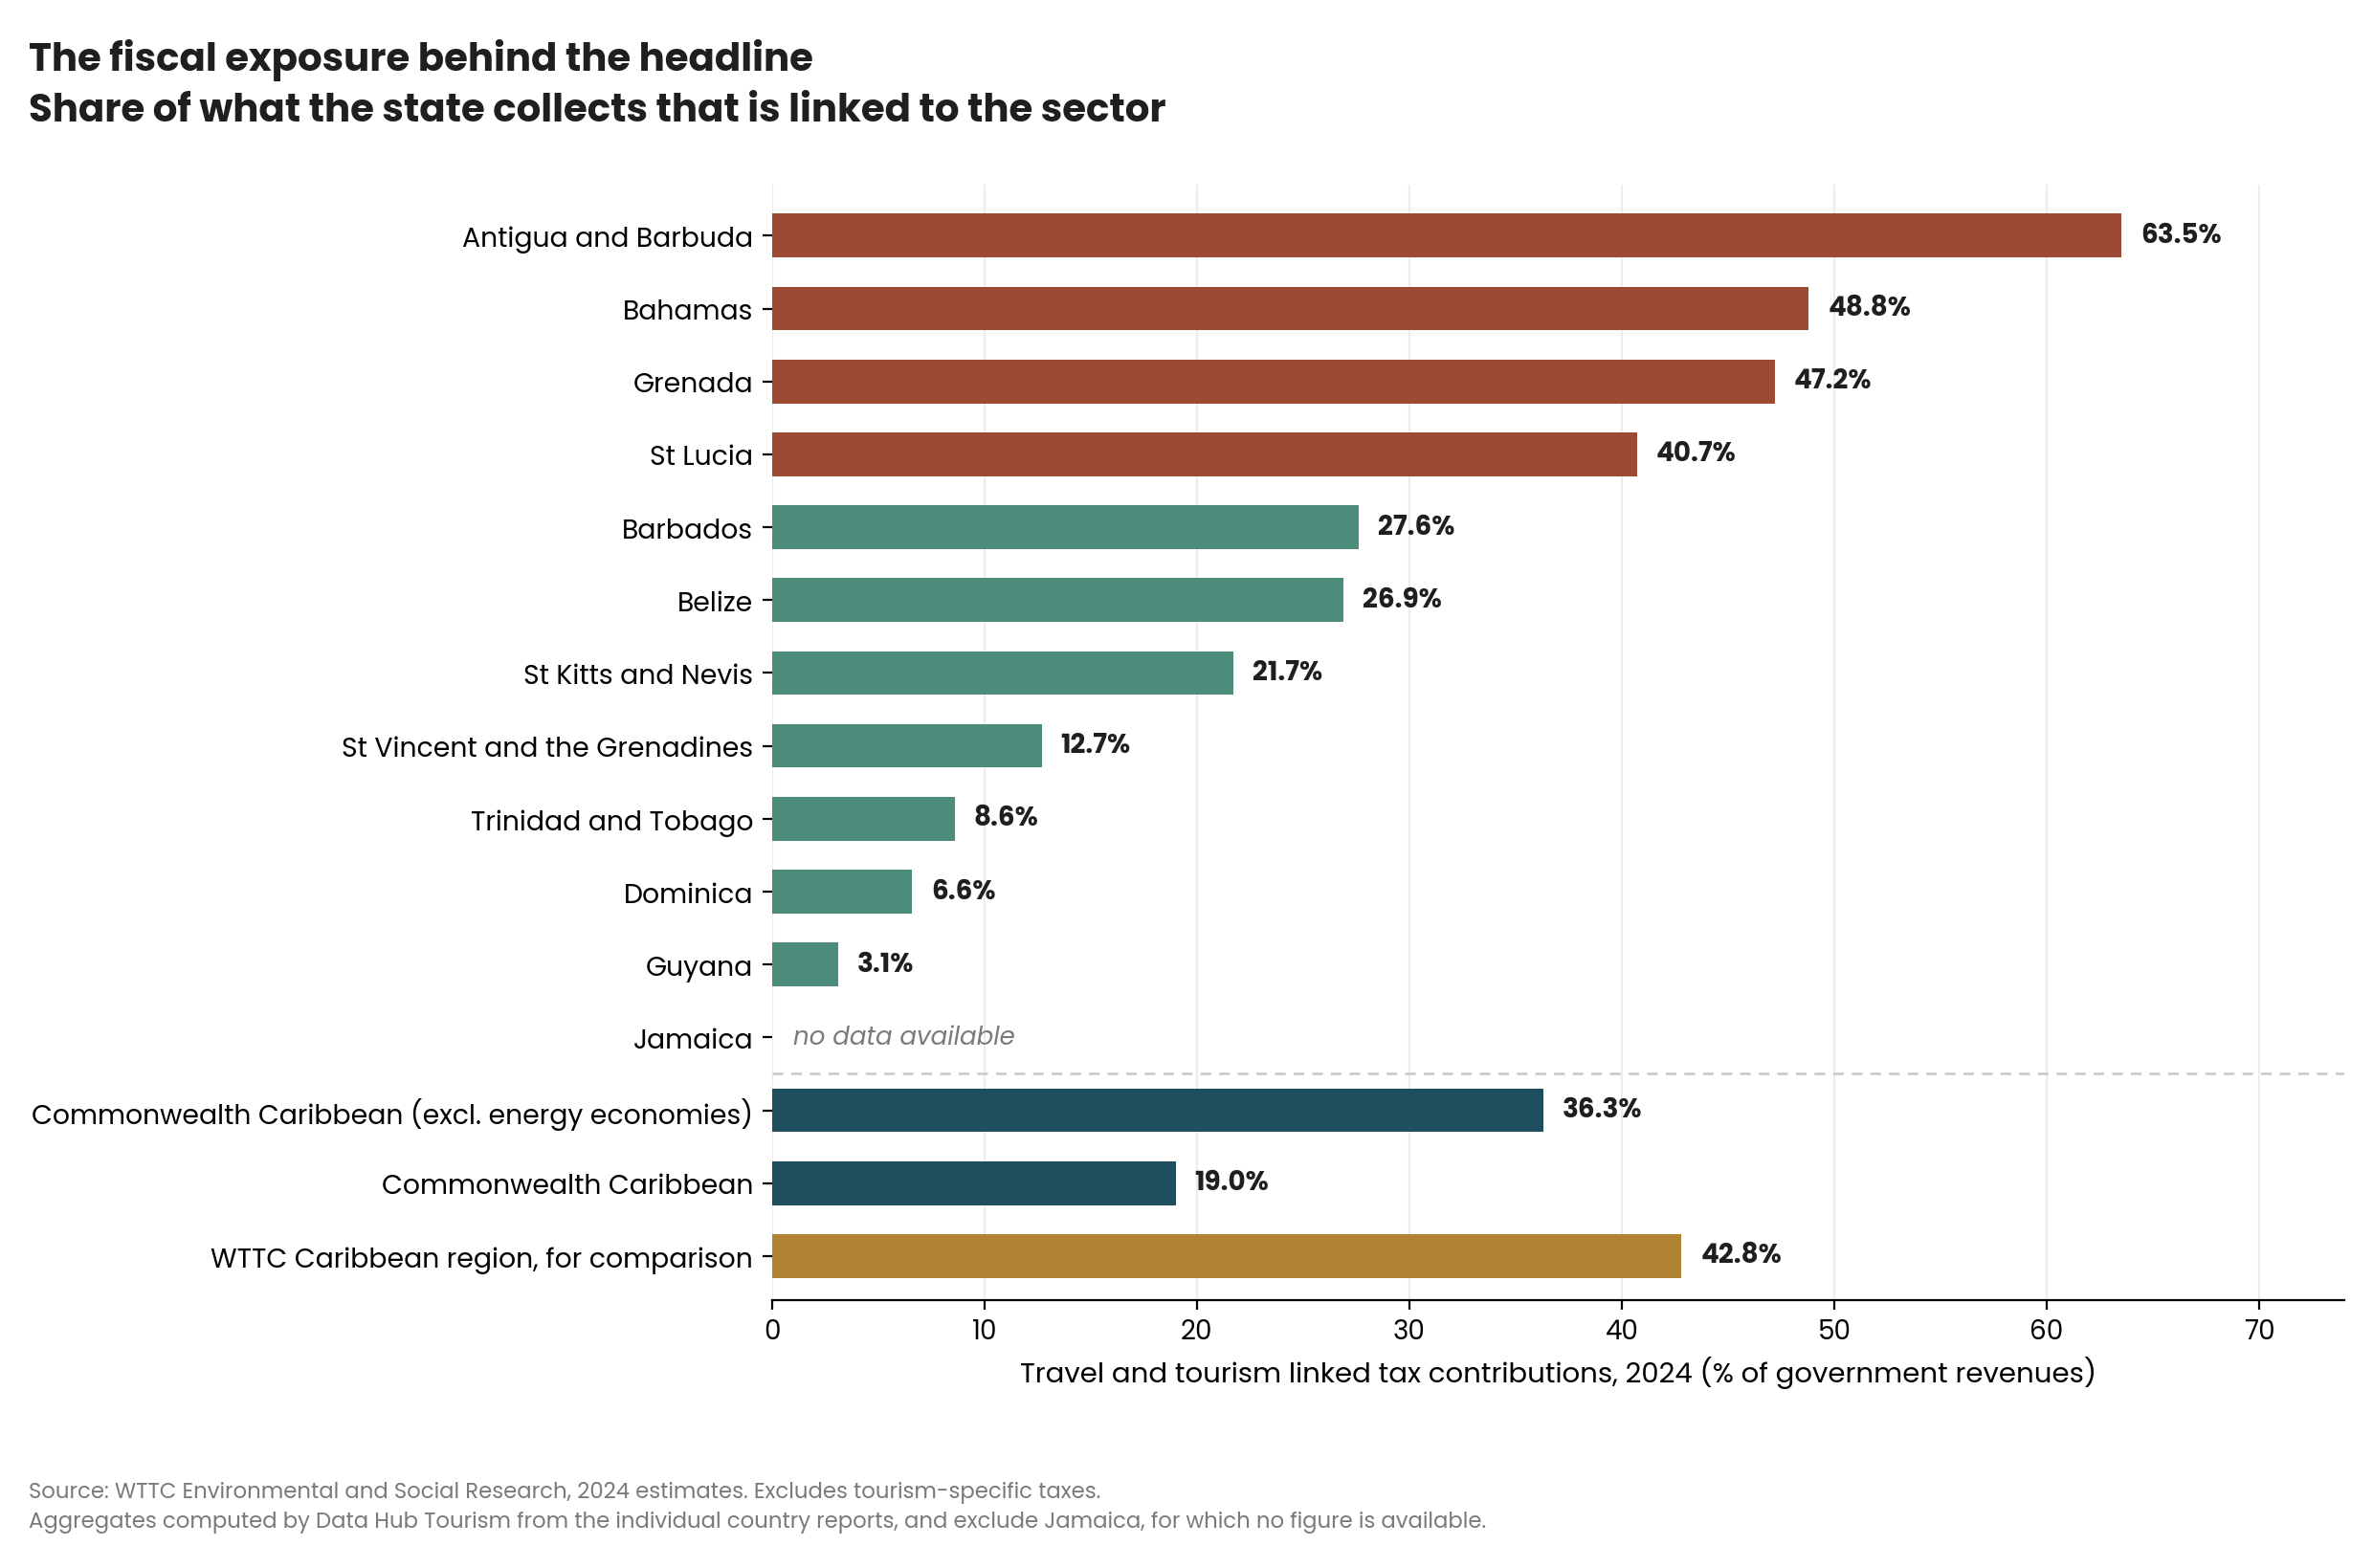
All values are in constant 2025 prices and exchange rates, as reported by WTTC in April 2026. Aggregate rows are computed by Data Hub Tourism from the individual country reports. Tax figures are 2024 estimates, and the two tax aggregates exclude Jamaica, for which no figure is available.
Antigua and Barbuda
Tourism's total contribution reached 77.3% of GDP in 2025, or USD 1.82 bn, alongside 86.3% of all employment, 81.4% of exports and 63.5% of government revenues. On every exposure measure in this dataset, Antigua and Barbuda sits at the top. Two qualifications matter. First, when a total contribution figure approaches 80% of GDP, the measure is describing how deeply the sector is wired into the rest of the economy through supply chain, investment and induced effects, and it should not be read as a discrete slice of output. Second, real tourism output is only 2.3% above its 2019 level, against an implied 7.7% expansion in the wider economy, so the falling share here reflects a sector that has barely grown rather than a diversifying economy pulling away. Exposure is close to absolute while the growth that would build reserves against it has not materialised. Fiscal resilience planning, rather than demand generation, is therefore the binding policy question, because a weak season arrives as a revenue event across roughly two thirds of the budget.
Grenada
Tourism accounted for 60.0% of GDP in 2025, or USD 889.1 mn, up from 47.0% in 2019, with 46.3% of employment, 66.6% of exports and 47.2% of government revenues. Grenada is the one market in the group where a sharply rising share is unambiguously a tourism story: real tourism output rose 34.8% since 2019 against an implied 5.6% for the wider economy. International visitors generate 97.0% of tourism spending, the highest international share in the group, which means there is effectively no domestic demand to absorb an external shock. Set against that, tourism GDP contracted 7.2% in real terms in 2025 while the wider economy grew 3.5%, the second largest negative gap in the group. CoStar data show Grenada carrying the highest volume of rooms under construction as a share of tracked inventory among these twelve markets, so supply is arriving into a year in which measured sector output fell. That raises the risk of rate dilution if the new rooms open before demand recovers, which would compound rather than offset the 2025 result.
St Lucia
Tourism contributed 57.4% of GDP in 2025, or USD 1.56 bn, down from 60.0% in 2019, and supports 67.1 thousand jobs, equal to 70.1% of all employment, the second highest labour dependence in the group. Visitor exports represent 79.3% of total exports and tourism-linked taxes 40.7% of government revenues. The falling share is a relative movement rather than a contraction: real tourism output is 9.4% above 2019 while the implied whole economy is 14.4% above it. The concern is the most recent year. Tourism GDP fell 4.0% in real terms in 2025 against whole-economy growth of 3.2%, a gap of 7.2 percentage points. Data Hub Tourism analysis of CoStar hotel performance data identifies St Lucia as the clearest regional case of rate-led RevPAR stagnation, where pricing has carried performance while volume has not followed, and the WTTC figures are consistent with that reading. Where 70% of jobs sit behind a sector whose real output declined last year, employment is the variable to watch, and national labour force data will show it before the next modelled estimate does.
Bahamas
At USD 7.62 bn, the Bahamas has the largest tourism economy among these twelve markets in absolute terms, accounting for 46.2% of GDP, 47.8% of employment and 48.8% of government revenues. Its rising share is genuine, with real tourism output up 19.2% since 2019 against an implied 13.5% for the economy as a whole. The defining structural feature is source-market concentration: the United States accounts for 86% of inbound arrivals, the highest single-market dependence in the group, with Canada second at 5%. Taken together, those two figures mean that demand conditions in one foreign country effectively underwrite close to half the national budget. Tourism GDP grew 0.5% in real terms in 2025 against whole-economy growth of 3.0%, so a large and highly exposed sector was close to flat in a year when the rest of the economy advanced. For planners, scenario work on United States outbound demand, whether driven by currency, policy or consumer conditions, is effectively fiscal scenario work in this market.
St Kitts and Nevis
Tourism contributed 45.4% of GDP in 2025, or USD 539.7 mn, and supports 12.8 thousand jobs, or 60.3% of all employment. It was one of only four markets where the sector outgrew the wider economy last year, at 5.8% against 1.7%. The longer view is more sober: real tourism output is 4.2% above 2019, and the implied whole economy is effectively flat at negative 0.2%, so the rising share reflects a static economy as much as a growing sector. The relationship between the output and employment shares also repays attention: a sector generating 45.4% of output while employing 60.3% of the workforce indicates comparatively low output per worker. Data Hub Tourism analysis of CoStar hotel performance data finds the low occupancy in this market to be structural rather than a sampling artefact. Read together, the two observations point to a productivity constraint rather than a demand constraint, since the labour is committed to the sector while the assets are not being used intensively. Yield and utilisation, rather than arrival volume, are where the headroom sits.
St Vincent and the Grenadines
Tourism accounted for 35.2% of GDP in 2025, or USD 443.0 mn, marginally below its 36.2% share in 2019, and supports 18.9 thousand jobs, or 48.3% of employment. The slight fall in share sits on healthy underlying growth, with real tourism output 13.0% above 2019 against an implied 16.2% for the wider economy, so this is a market where the rest of the economy has grown slightly faster rather than one where tourism has weakened. Source markets are comparatively spread, with the United States at 42%, the United Kingdom at 16%, Canada at 10% and Trinidad and Tobago at 8%, which places this among the less concentrated markets in the group. Fiscal capture from the sector is low relative to peers of similar structure, at 12.7% of government revenues against 40.7% in St Lucia and 47.2% in Grenada, which is noted further below.
Belize
Tourism contributed 32.7% of GDP in 2025, or USD 1.08 bn, up from 30.1% in 2019, with real output 28.3% above its 2019 level against an implied 18.1% for the wider economy. On the decomposition, Belize is the second clearest case after Grenada of a share that has risen because the sector itself grew. The employment movement is the most notable in the group: the sector supported 65.5 thousand jobs in 2019 and 81.7 thousand in 2025, lifting its share of national employment from 39.0% to 49.4%. That is a structural shift in the labour market rather than a cyclical recovery, and it means household exposure to the sector has deepened materially in six years. Against that, the United States accounts for 74% of inbound arrivals, so the deepening labour exposure rests on a single source market. Tourism GDP grew 0.9% in real terms in 2025 against whole-economy growth of 1.5%, and the job base has expanded faster than output has, which over time places downward pressure on sector wages unless productivity follows.
Jamaica
At USD 6.00 bn, Jamaica has the second largest tourism economy in the group, accounting for 29.4% of GDP and 446.3 thousand jobs, or 30.1% of employment. The direction matters more than the level, and on this decomposition Jamaica is the flattest market in the group: real tourism output is 0.5% above 2019 and the implied whole economy 1.2% above it. Six years have moved almost nothing. Within that, real international visitor spending sits 7.3% below its 2019 level, which indicates that volume has recovered while constant-price spend per visitor has fallen. Set against inbound arrivals that are 71% United States sourced, the combination points to yield rather than arrivals as the binding constraint, and suggests that strategy or marketing built around arrival counts may be optimising the wrong variable. WTTC forecasts a 9.0% real rebound in 2026, a substantial turn from a year of slight contraction, which monthly data through the year will show.
Barbados
Tourism contributed 23.1% of GDP in 2025, or USD 1.76 bn, down from 26.7% in 2019. The decomposition makes this one of the two genuinely adverse cases in the group: real tourism output is 3.7% below its 2019 level while the implied whole economy is 11.3% above it, so the share has fallen because the sector shrank while the rest of the economy grew. Within that, 2025 was the strongest trading year in the group, with tourism GDP up 10.0% in real terms against whole-economy growth of 3.0%, which suggests a recovery that began late rather than one that failed. Employment has not kept pace: the sector supports 41.9 thousand jobs, 11.0% fewer than in 2019, indicating an output-led rather than a hiring-led recovery. Barbados is also the only market here with a genuine dual source-market anchor, at 34% United States and 31% United Kingdom, with Canada a further 12%, which is a real diversification asset and rare in the group.
Dominica
Tourism accounted for 22.3% of GDP in 2025, or USD 163.7 mn, down from 27.7% in 2019, the largest fall in share in the group at 5.4 percentage points, and the second adverse case on the decomposition: real tourism output is 15.4% below its 2019 level while the implied whole economy is 5.1% above it. Employment has fallen from 11.3 thousand to 10.6 thousand jobs. This is the only market in the group where both output and employment remain below their pre-pandemic positions. Dominica also has the most diversified source-market profile here, with the United States at 28%, Guadeloupe at 16%, the United Kingdom at 7%, France at 6% and Martinique at 5%, drawing heavily on the neighbouring French Caribbean. Source-market diversification has therefore not, on its own, delivered recovery, which is a useful corrective to the assumption that spreading demand risk is sufficient. Dominica does not publish a monthly visitor arrivals series, so there is limited means of tracking the position between annual estimates.
Trinidad and Tobago
Tourism accounted for 9.2% of GDP in 2025, or USD 2.40 bn, up from 7.6% in 2019, supporting 49.9 thousand jobs, or 8.7% of employment. As set out above, roughly half of that share movement is a contracting denominator rather than a growing sector, since the implied whole economy is around 5% smaller in real terms than in 2019 on a maturing gas base. Visitor exports represent 8.1% of total exports, reflecting the scale of energy exports rather than weakness in visitor spending. The distinguishing structural feature is demand composition: domestic visitor spending accounts for 60.5% of total tourism spending, making this one of only two markets in the group where domestic demand exceeds international. That ties sector performance to local household income, and by extension to the energy cycle, as much as to external conditions, so the two do not offset each other. WTTC forecasts the GDP share moving from 9.2% to 9.8% by 2036, a rise of 0.6 percentage points over eleven years, which means that on these projections tourism does not become a material diversification lever within the forecast horizon. The national figure also conceals a sub-national divergence: Data Hub Tourism analysis of OAG schedule and traffic data indicates Tobago's international visitor market has contracted by roughly 40% since 2019 while the national arrivals figure shows a decline of around 2.7%, because Tobago's deterioration is absorbed into Trinidad's near recovery.
Guyana
Tourism accounted for 2.1% of GDP in 2025, down from 5.9% in 2019, which on a share basis is among the steepest declines in the group and is entirely a denominator effect. Real tourism output is 141.9% above its 2019 level, rising from USD 281.6 mn to USD 681.2 mn, and grew 13.3% in 2025, the fastest rate among these twelve markets. Over the same period the whole economy expanded by an implied 580% in real terms as oil production scaled from first output in December 2019 to four producing vessels by 2025. The government has forecast average production of 840,000 barrels a day for 2026, and real GDP expanded by an estimated 33.3% in the first half of 2026, with the non-oil economy growing 10.1%. Guyana is therefore the cleanest demonstration in this dataset that tourism's share of GDP is a ratio and not a performance measure: a sector can more than double in real terms and register a collapsing share. The implication extends beyond Guyana. Any destination benchmarked or targeted on tourism share of GDP is being measured against a denominator it does not control, and where a national plan sets a share-of-GDP target, success in another sector registers as failure in this one.
Four observations that cut across the group
The sector underperformed its own economies in 2025. The gap between tourism GDP real growth and whole-economy real growth was negative in eight of twelve markets, and negative on the Commonwealth Caribbean aggregate in both versions, at 6.8 points for all twelve and 1.6 points for the ten tourism-led markets. The WTTC regional aggregate points the other way at positive 1.8 points, carried by the Dominican Republic, Cuba, Puerto Rico and other economies outside this group. Guyana is the one market where the negative gap should not be read as underperformance.
Share of GDP is a ratio, and the denominator is doing much of the work. Across all twelve markets the combined tourism share fell from 26.1% in 2019 to 21.5% in 2025, almost entirely because of Guyana's oil expansion. Strip out the two energy economies and the same measure is flat, at 37.5% to 38.0%. Of the twelve markets, only four have a rising share driven by tourism outgrowing the economy, and two have a falling share because the sector itself contracted. Where a dependency figure is used as a performance indicator, whether in a national plan, an investment case or a ministerial speech, it should be paired with the absolute real change, or it will be read backwards.
The fiscal channel is the under-reported exposure. Tourism-linked taxes are estimated at 63.5% of government revenues in Antigua and Barbuda, 48.8% in the Bahamas, 47.2% in Grenada and 40.7% in St Lucia. Across the tourism-led markets with available data the combined figure is 36.3%. This receives considerably less attention than the GDP share and is the more decision-relevant of the two, because GDP share describes the shape of the economy while revenue share determines whether the state can meet payroll and service debt through a weak season. For ministries of finance in the higher-exposure markets, a tourism demand forecast functions as a revenue forecast and warrants equivalent scrutiny.
Source-market concentration is not visible in the headline figures. The United States is the largest inbound source market in all twelve markets, ranging from 28% of arrivals in Dominica to 86% in the Bahamas. Only three hold a second source market above 20%, being Barbados with the United Kingdom at 31%, and Antigua and Barbuda and St Lucia with the United Kingdom at 22% each. None of this concentration appears in the GDP, employment or investment figures that dominate public discussion, yet it determines how much of the modelled contribution is genuinely exposed to a single policy, currency or demand movement in one country. It is also the exposure a regional aggregate is least able to describe, since the source-market mix of the Dominican Republic or Cuba has no bearing on it.
Notes on the published figures
Five points about the data itself, each of which affects how the numbers above should be read.
Grenada's dependency figure moves in a way the others do not. WTTC forecasts Grenada's tourism GDP to grow 10.9% in real terms in 2026 while the whole economy grows 0.3%, lifting tourism's share from 60.0% to 66.3%. Recomputing from base data reproduces that share exactly, but the three figures together imply that the rest of the measured economy contracts by roughly 16% in real terms during 2026. Across the twelve markets the equivalent implied change ranges from negative 6% to positive 18%, so Grenada sits well outside the pattern. Working backwards from the published growth rates also implies a Grenada share of around 66.9% in 2024, 60.0% in 2025 and 66.3% in 2026. A dependency statistic that moves by six or seven percentage points a year is better used as a range than as a point estimate.
The whole-economy estimates diverge from national sources in two markets. For Guyana, WTTC reports economy-wide real growth of 27.0% in 2025 against an official estimate of 19.3%. For Trinidad and Tobago, WTTC reports growth of 1.6%, while the Ministry of Finance projected a contraction of 0.8%. Because the share of GDP depends on both terms, the denominator carries the same uncertainty as the numerator.
Barbados's wage quality figure sits well outside the group. High-wage roles are reported at 6.7% of direct tourism employment, against a range of 19.5% to 41.1% across the other eleven markets. National labour force data would establish whether this reflects wage structure or a difference in classification.
St Vincent and the Grenadines shows a low fiscal capture relative to peers. Tourism-linked taxes are estimated at 12.7% of government revenues, against 40.7% in St Lucia and 47.2% in Grenada, markets of broadly comparable structure. The gap may reflect a different revenue base rather than a different relationship with the sector, and national fiscal accounts would settle it.
One figure is not available for Jamaica. No tourism-linked tax share is published for Jamaica. It is therefore absent from the fiscal comparison and from both fiscal aggregates, which understate them by an unknown amount given the size of the Jamaican economy. All other figures in this report are available for all twelve markets.
Method and scope
All twelve independent Commonwealth Caribbean markets are covered. WTTC does not publish a Commonwealth Caribbean total, so the aggregates here are computed by Data Hub Tourism by summing the constant-price values in the twelve country reports, with whole-economy GDP and employment derived for each market by dividing the published contribution by its published share. Rounding in the published shares places the all-twelve share of GDP between 21.3% and 21.7%. Guyana and Trinidad and Tobago are reported separately throughout because they hold approximately 50% of combined GDP but only 12% of combined tourism GDP.
The WTTC Caribbean region is shown for contrast only, and the twelve markets here represent roughly 29% of it.
All figures are modelled estimates in constant 2025 prices, as reported in April 2026, with 2026 onward forecast. Total contribution includes direct, indirect and induced effects and is not comparable with the direct contribution figures published in national Tourism Satellite Accounts. Tax and employment quality figures are 2024 estimates on a separate basis. Source-market shares are attributed by WTTC to Oxford Economics, national sources and UN Tourism.
Sources: WTTC Economic Impact Research 2026, produced with Oxford Economics; WTTC Environmental and Social Research. Commonwealth Caribbean aggregates computed by Data Hub Tourism from the twelve individual country reports. Supporting references draw on CoStar hospitality market reports, OAG schedule and traffic data, and national macroeconomic sources. Analysis by Data Hub Tourism.