
The United States is the largest single source market for every Commonwealth Caribbean destination, ranging from 28 per cent of arrivals in Dominica to 86 per cent in the Bahamas. That position tends to be treated as a settled condition rather than as a variable. Four measurable shifts in the American travel market indicate that the composition of that demand is changing faster than headline arrival figures reveal.
What the data shows
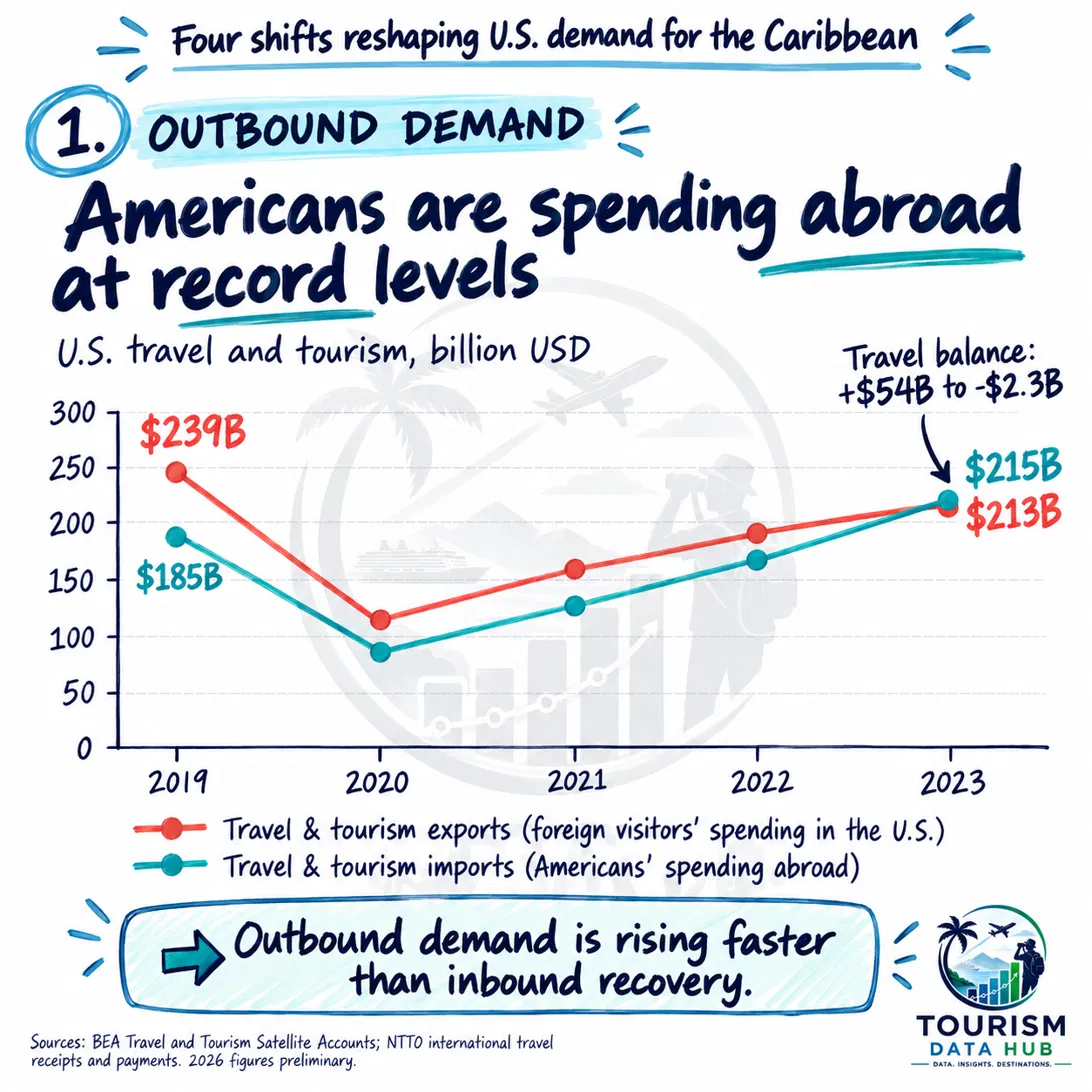
Outbound spending has overtaken inbound. In 2019, US travel and tourism exports, meaning foreign visitors' spending inside the United States, stood at 239 billion dollars against imports, meaning Americans' spending abroad, of 185 billion dollars. By 2023 the positions had converged, with imports at 215 billion dollars and exports at 213 billion dollars. The travel balance moved from a surplus of 54 billion dollars to a deficit of 2.3 billion dollars.
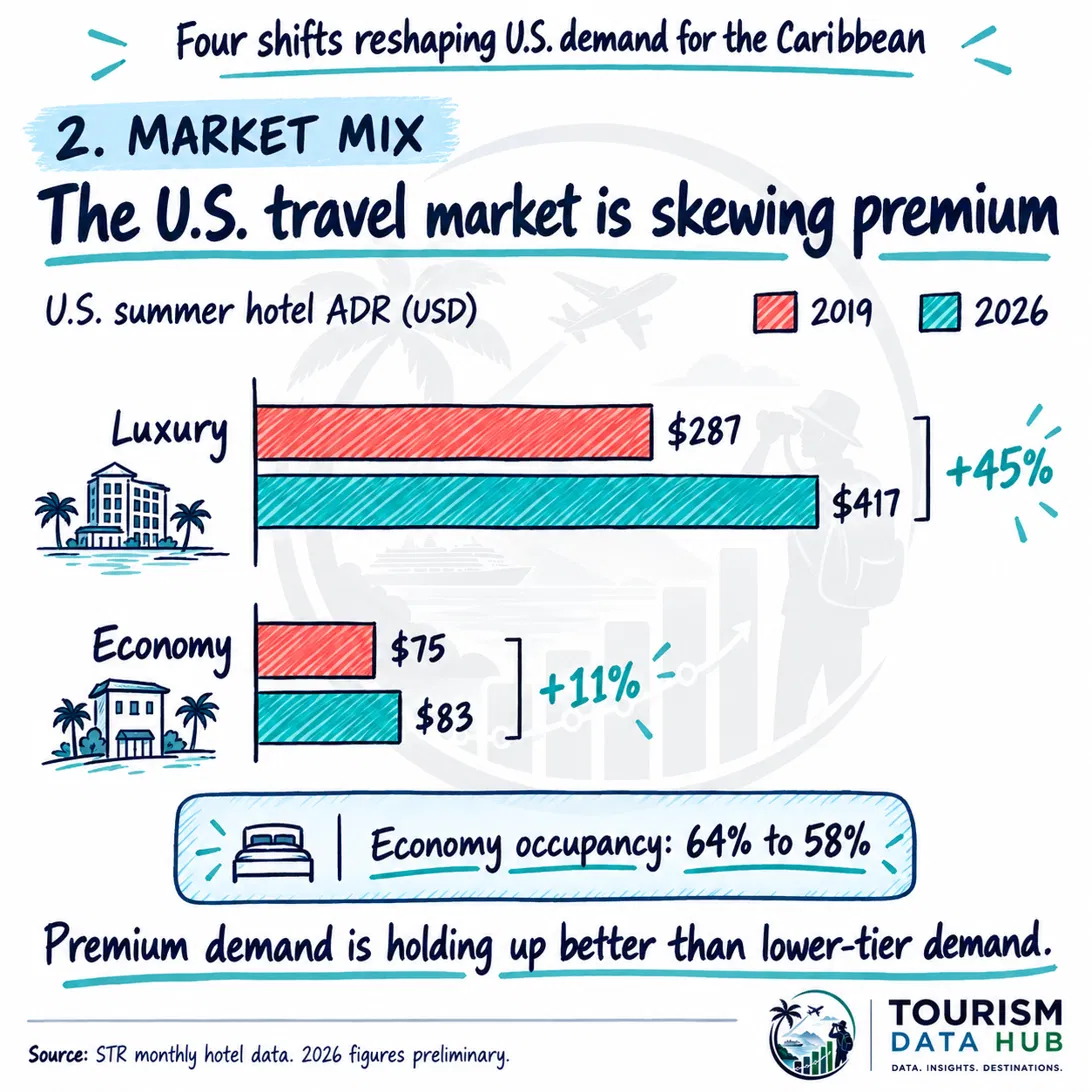
The market is skewing premium. US summer hotel average daily rate in the luxury segment rose from 287 dollars in 2019 to 417 dollars in 2026, an increase of 45 per cent in nominal terms. The economy segment rose from 75 dollars to 83 dollars, an increase of 11 per cent. Economy occupancy fell from 64 per cent to 58 per cent, a decline of 6 percentage points.
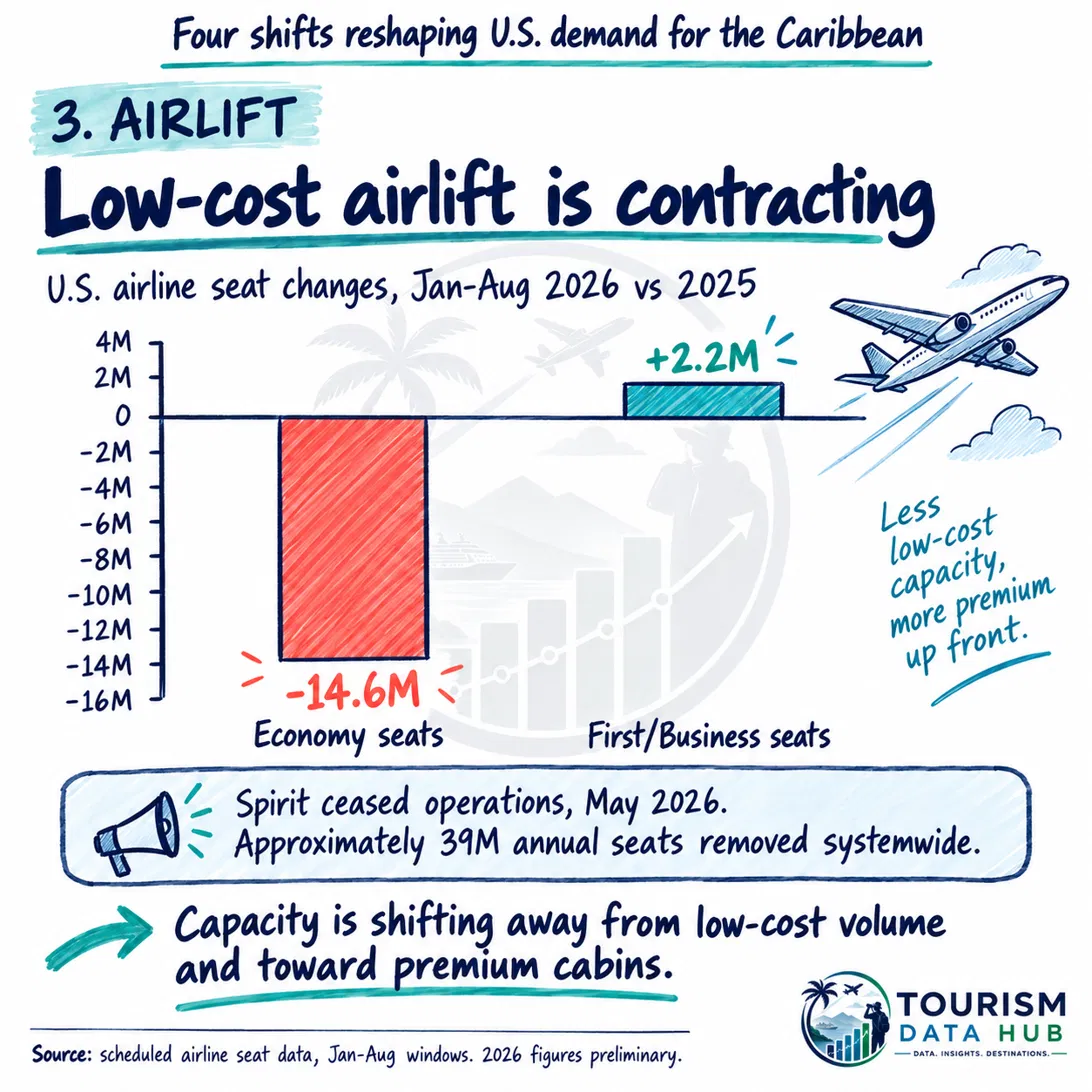
Low-cost airlift is contracting. Comparing January to August 2026 against the same window in 2025, US airline economy seat capacity fell by 14.6 million seats while first and business class capacity rose by 2.2 million. The net movement is a reduction of roughly 12.4 million seats, concentrated at the price-sensitive end. Spirit Airlines ceased operations in May 2026, removing approximately 39 million annual seats systemwide.
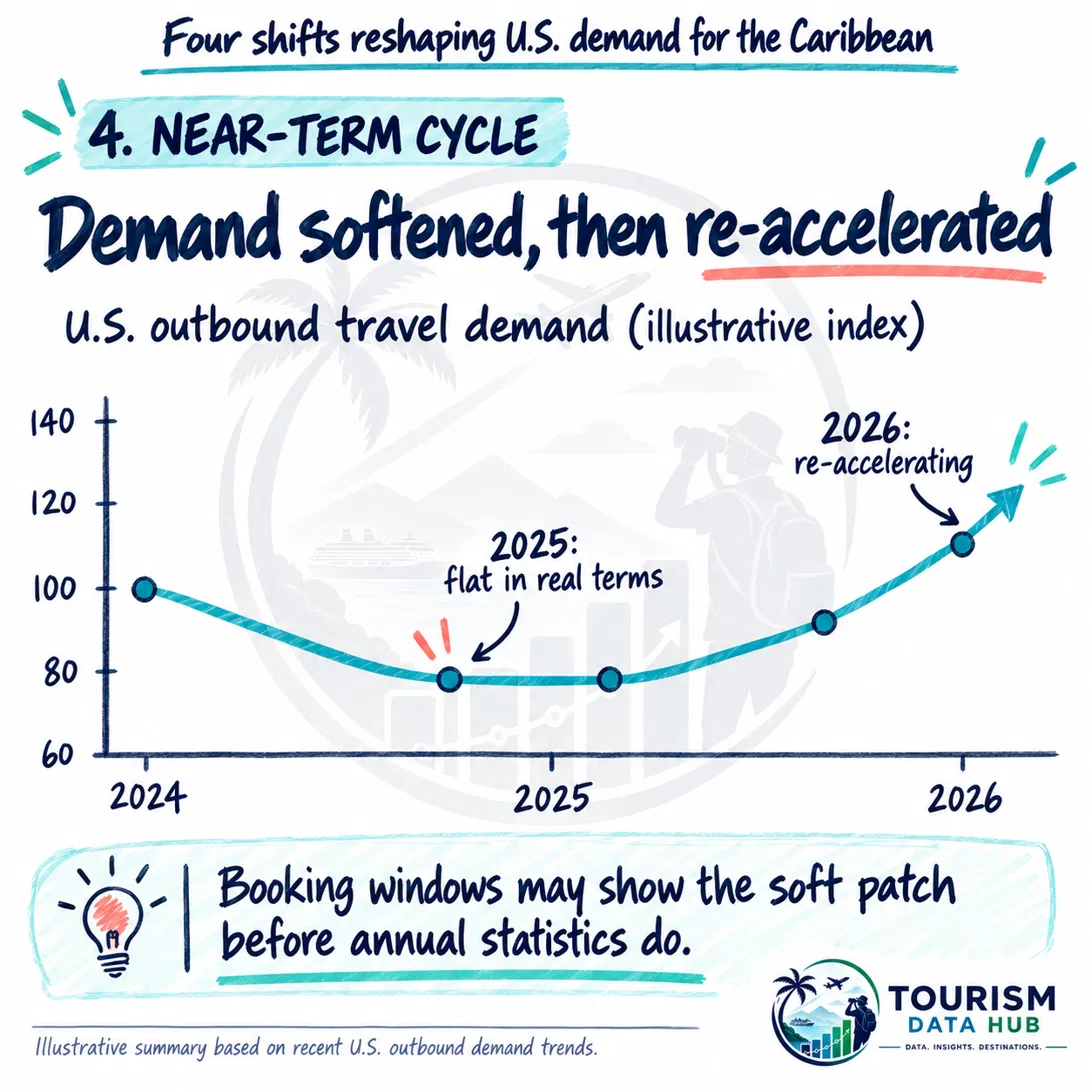
Demand softened, then re-accelerated. US outbound travel demand was broadly flat in real terms through 2025 before re-accelerating into 2026. The pattern matters more than the level: a soft patch followed by a recovery inside the same year nets out to apparent stability in an annual figure.
What may be driving it
Two of the four observations become sharper once they are adjusted.
Both hotel rate movements are nominal. Cumulative US consumer price inflation between 2019 and 2026 has been considerably greater than 11 per cent, which indicates that economy room rates have fallen in real terms while luxury rates have risen substantially in real terms. The divergence is therefore wider than the nominal figures show. More significantly, the economy segment is losing rate in real terms while also losing occupancy. Falling price alongside falling volume is not usually a discounting strategy. It is more consistent with genuine demand weakness at the price-sensitive end of the market.
The airlift movement points the same way. Seat supply determines which traveller can reach a destination at what price, so a contraction concentrated in economy capacity functions as a filter on the arriving visitor mix before any marketing decision is taken. The two movements are consistent with one another and compound in the same direction.
Airlift is frequently treated as an aviation matter handled separately from tourism strategy. On this evidence it is a demand-composition matter.
The outbound spending figures are more ambiguous than they first appear. A larger pool of American spending abroad is favourable for destinations that depend on US visitors. It is also a more contested pool. As American travellers range further, the Caribbean is not principally competing island against island for a fixed regional allocation. It is competing with southern Europe, Japan, Latin America and long-haul leisure destinations generally for the same discretionary trip.
What it means in practice
The composite reading is not that US travel is weak. On this evidence it is strong. It is that the American traveller is changing, in a direction that favours destinations able to serve higher-spending visitors who stay longer, while placing structural pressure on destinations whose proposition rests on affordable access and volume.
That distinction runs directly into the divergence already visible within the region. Markets carrying high supply pipelines relative to current trading are adding rooms into a source market whose price-sensitive segment is under pressure. Markets where performance has been carried by rate rather than volume face the same question from the other direction.
The airlift question is specific and answerable at destination level: which routes into each national airport carried low-cost capacity, what has happened to those seats, and what is scheduled forward. That analysis will differ by market, and a regional average will conceal more than it reveals.
The wider point concerns instrumentation. Travel demand rarely moves in a straight line, and a soft patch followed by a recovery within the same annual period can net out to something resembling stability in a year-end arrivals figure. A destination relying on annual arrivals as its primary measure will observe the outcome and miss the movement. Scheduled seat capacity, booking pace and booking window, fares, spending patterns and visitor mix show the shift earlier, and most are already available to a national tourism authority either directly or through existing subscriptions.